

Smart Globe
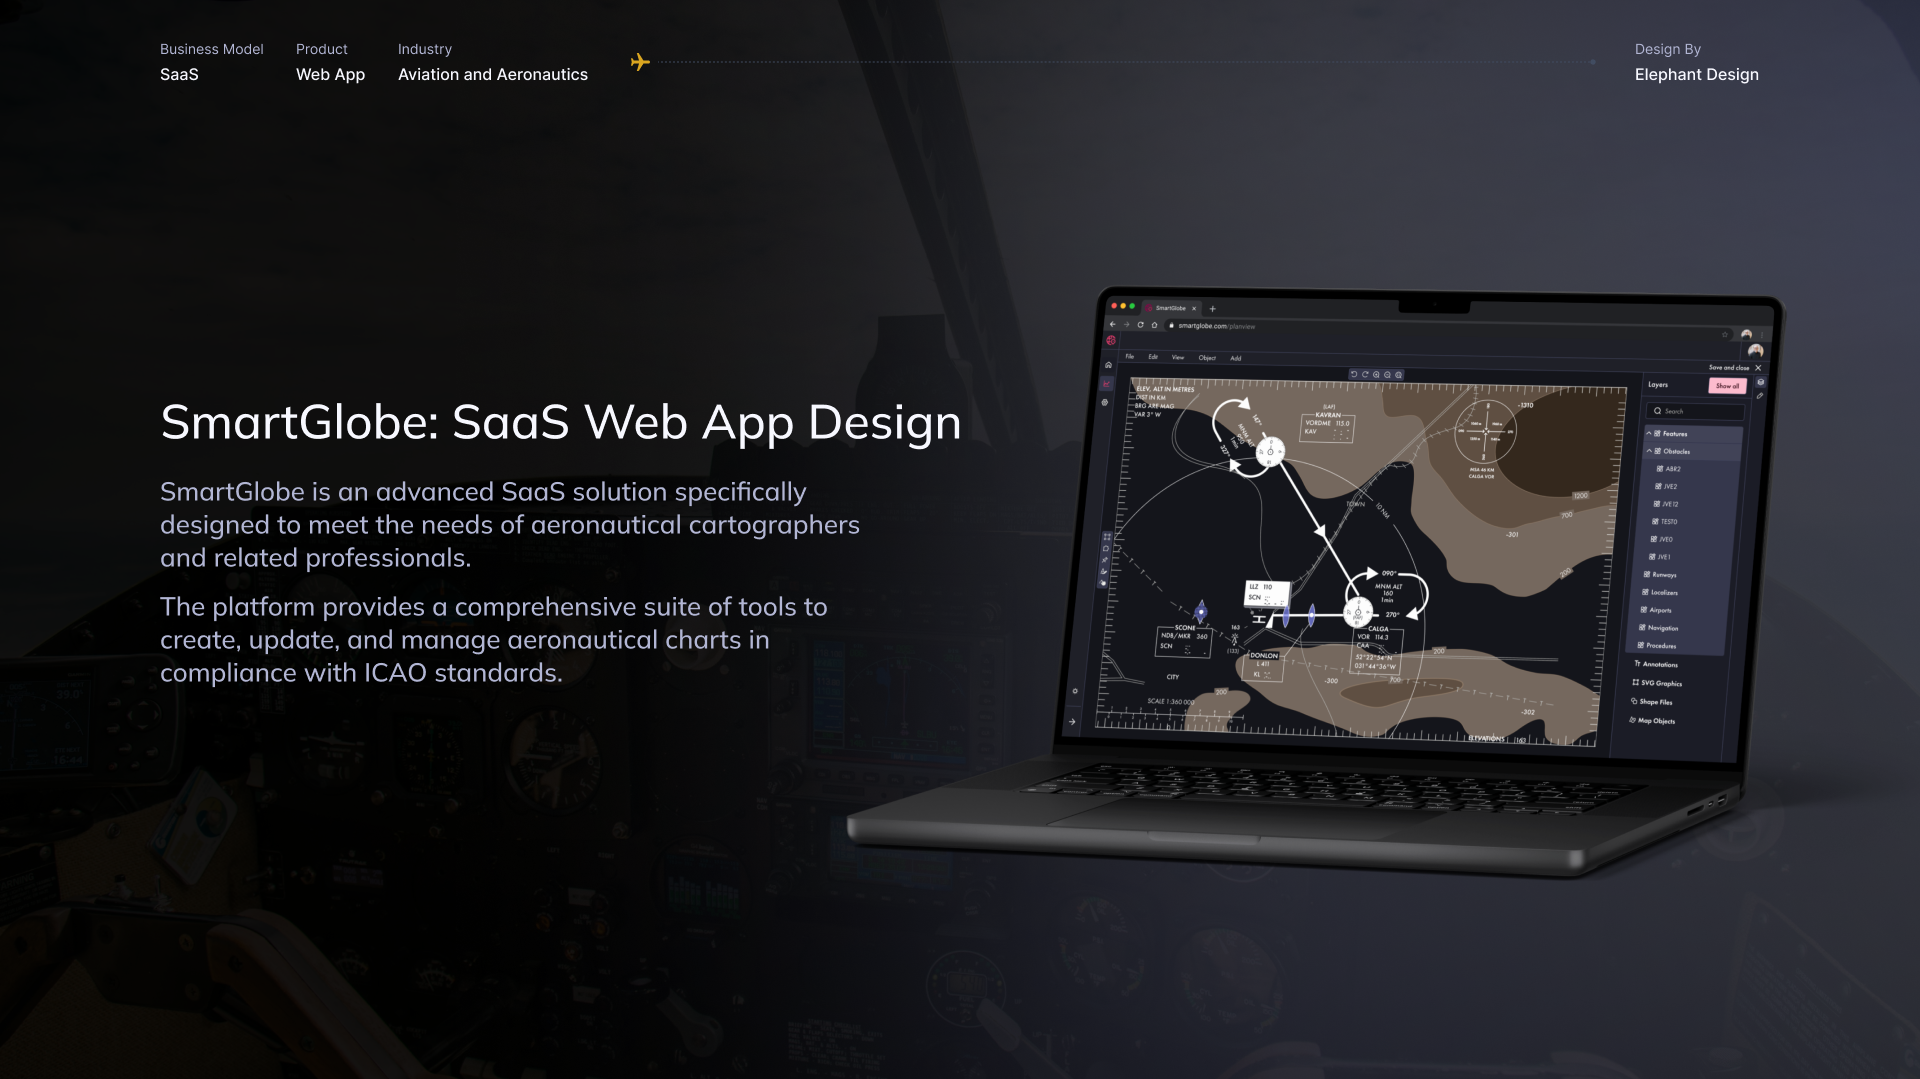
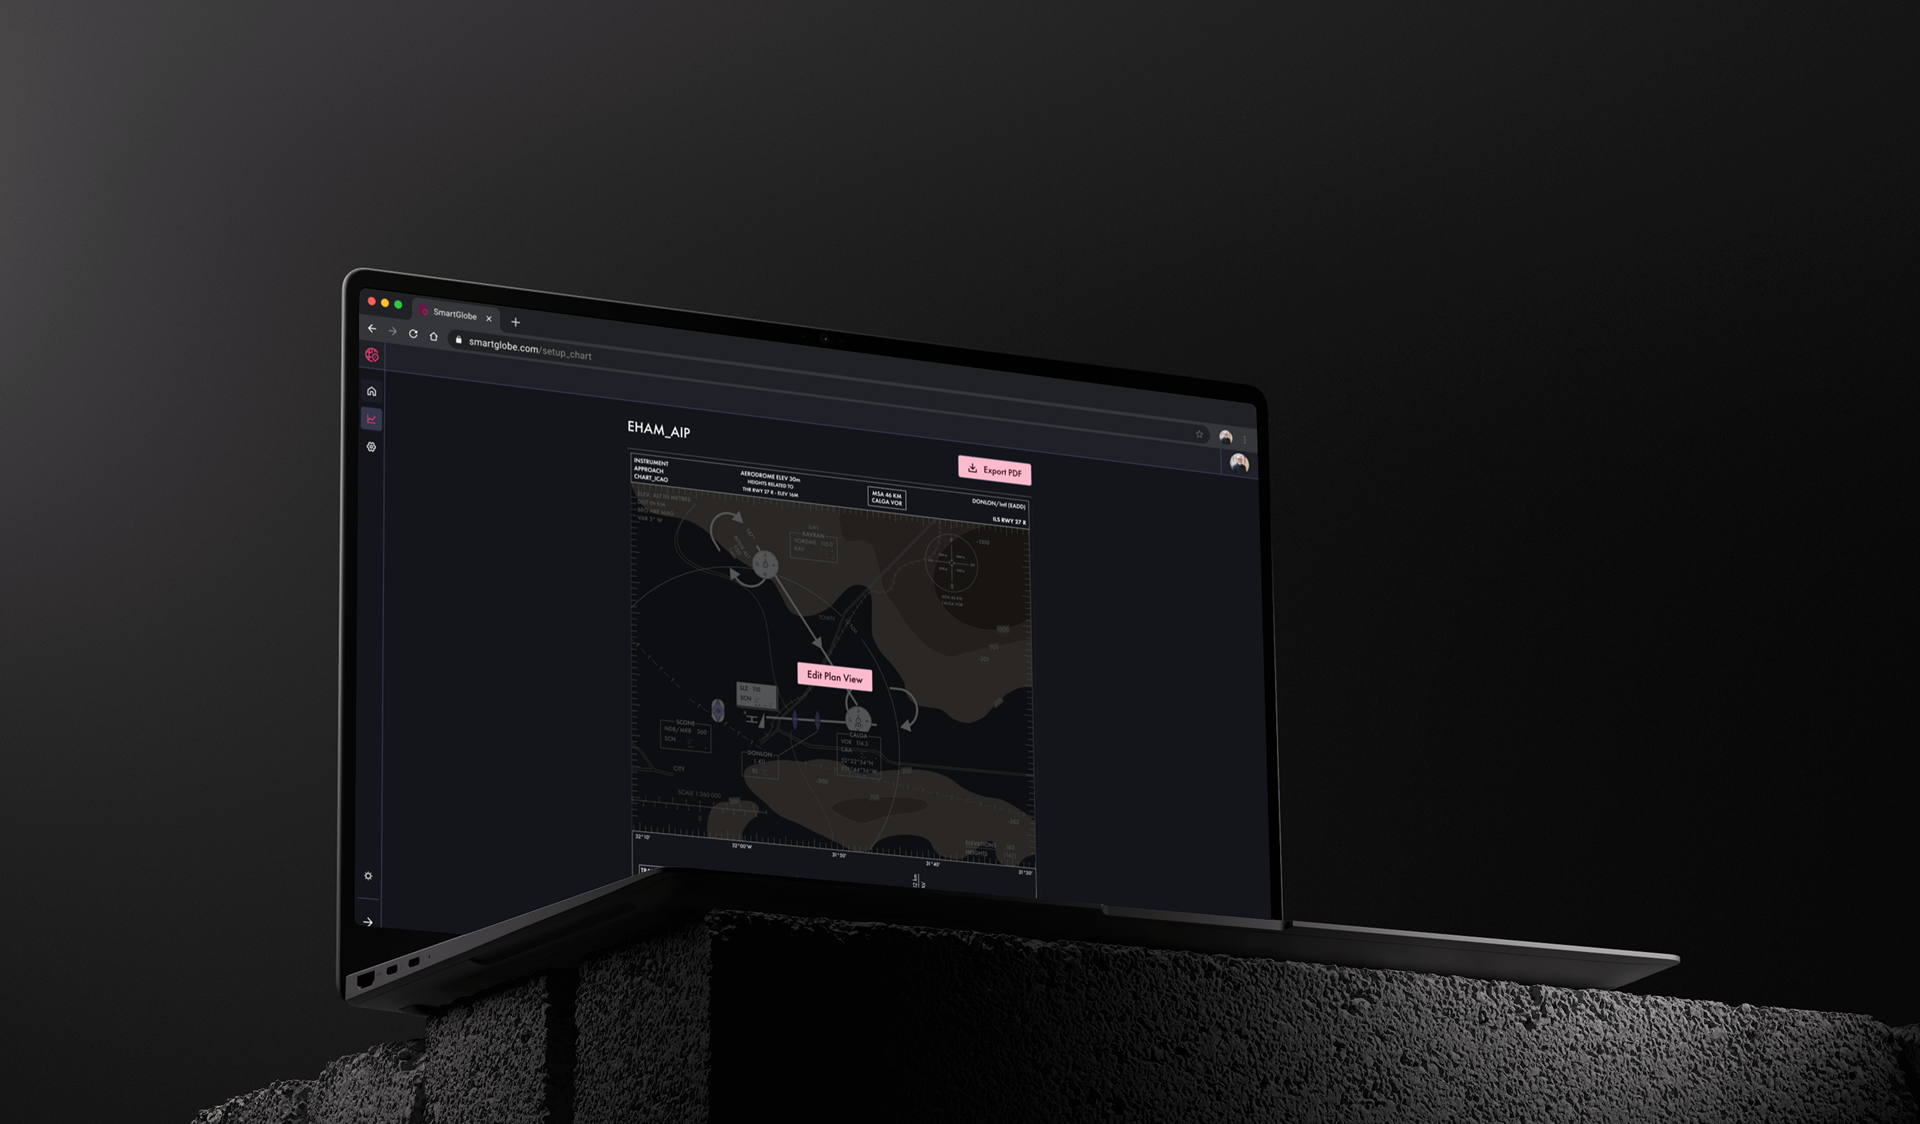
SmartGlobe is a cloud-based platform built for aeronautical cartographers and aviation professionals responsible for creating and maintaining flight navigation charts. The application streamlines complex mapping workflows while ensuring every chart complies with ICAO standards.
Project Description
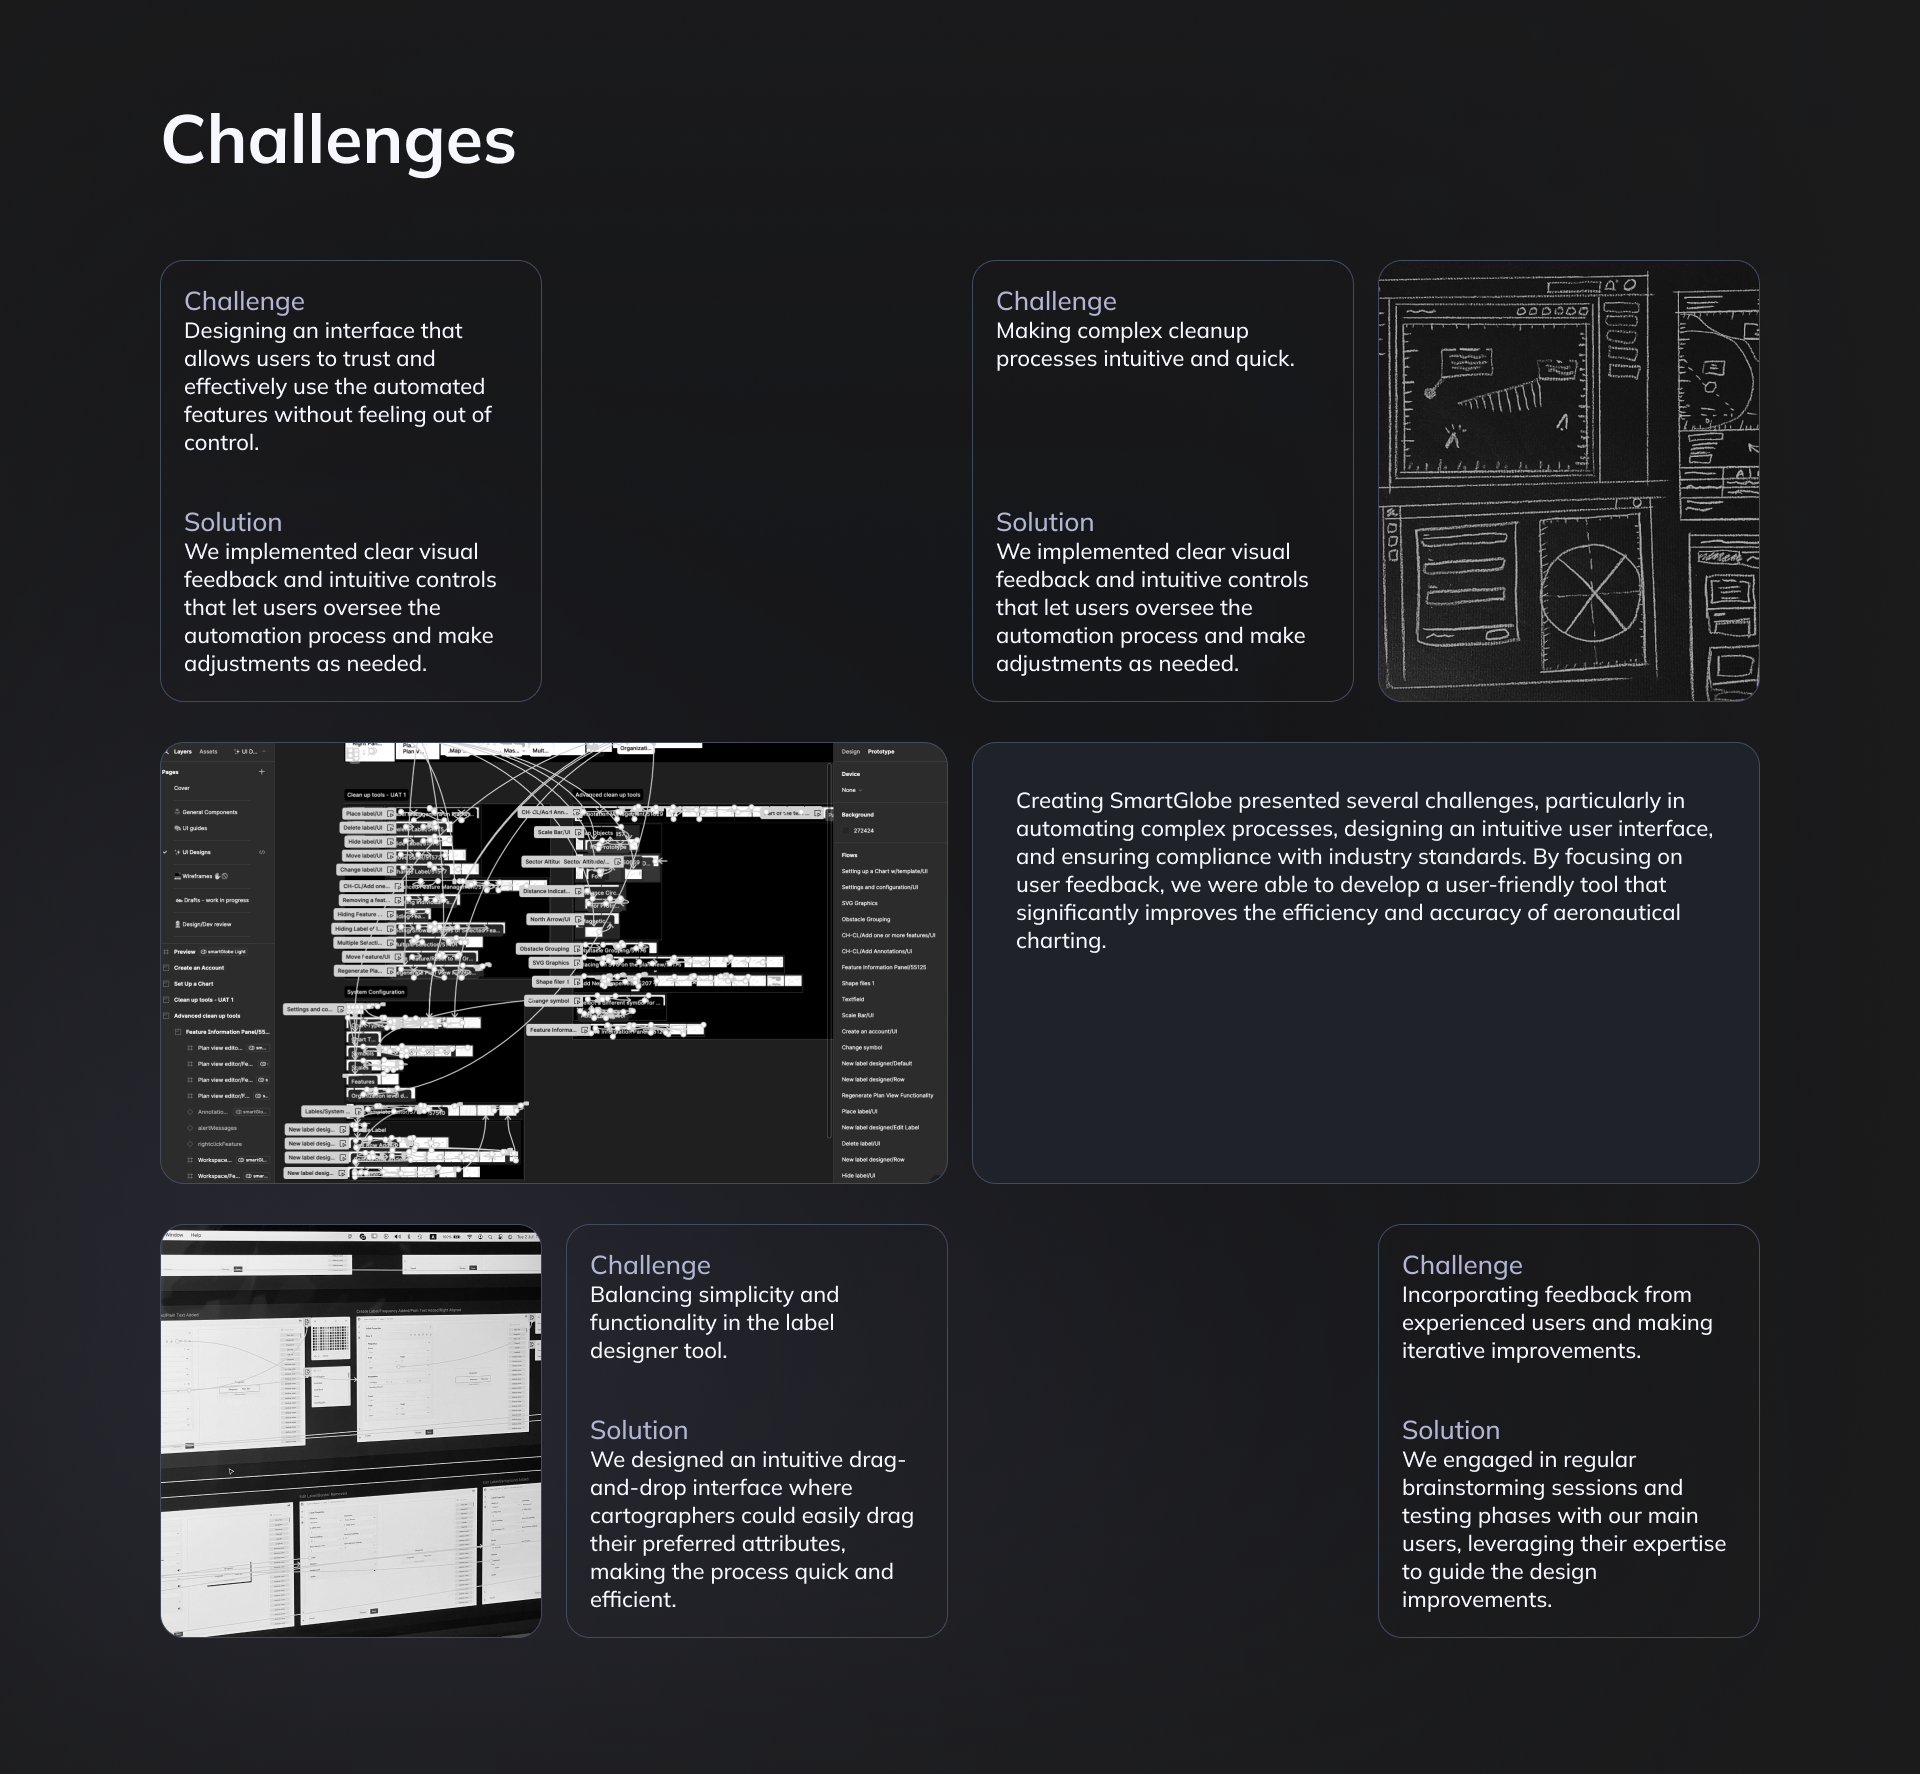
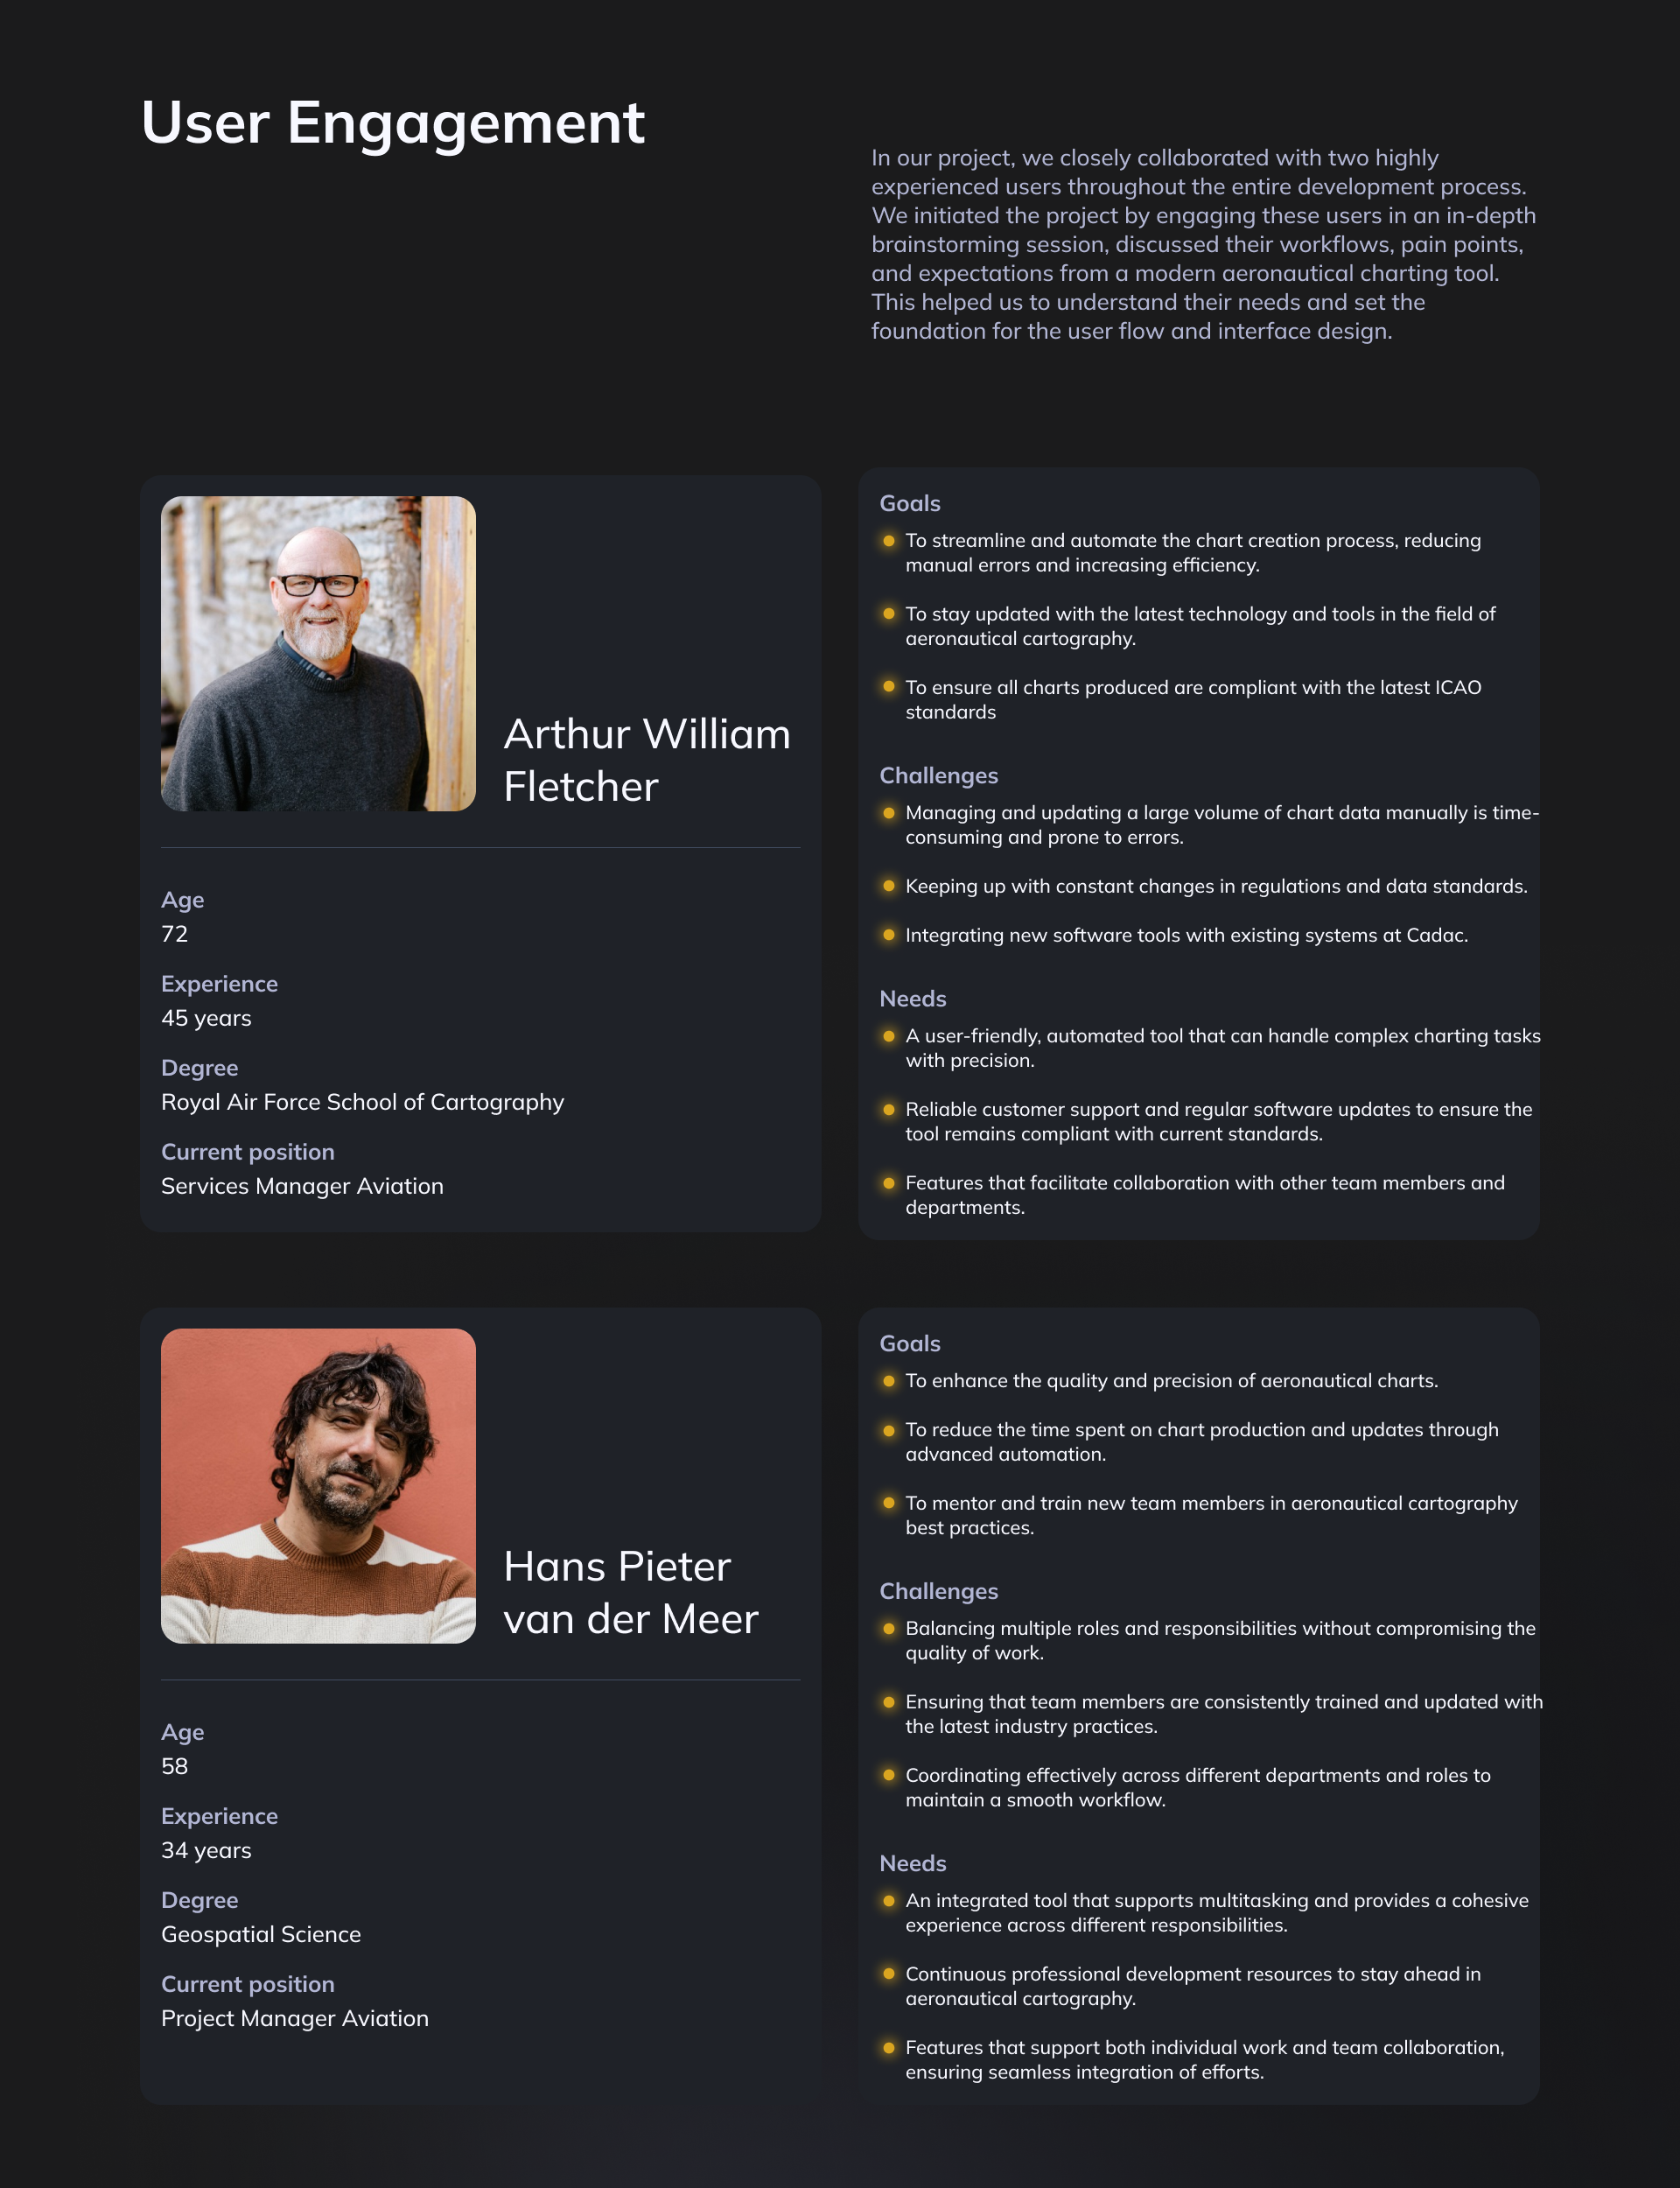
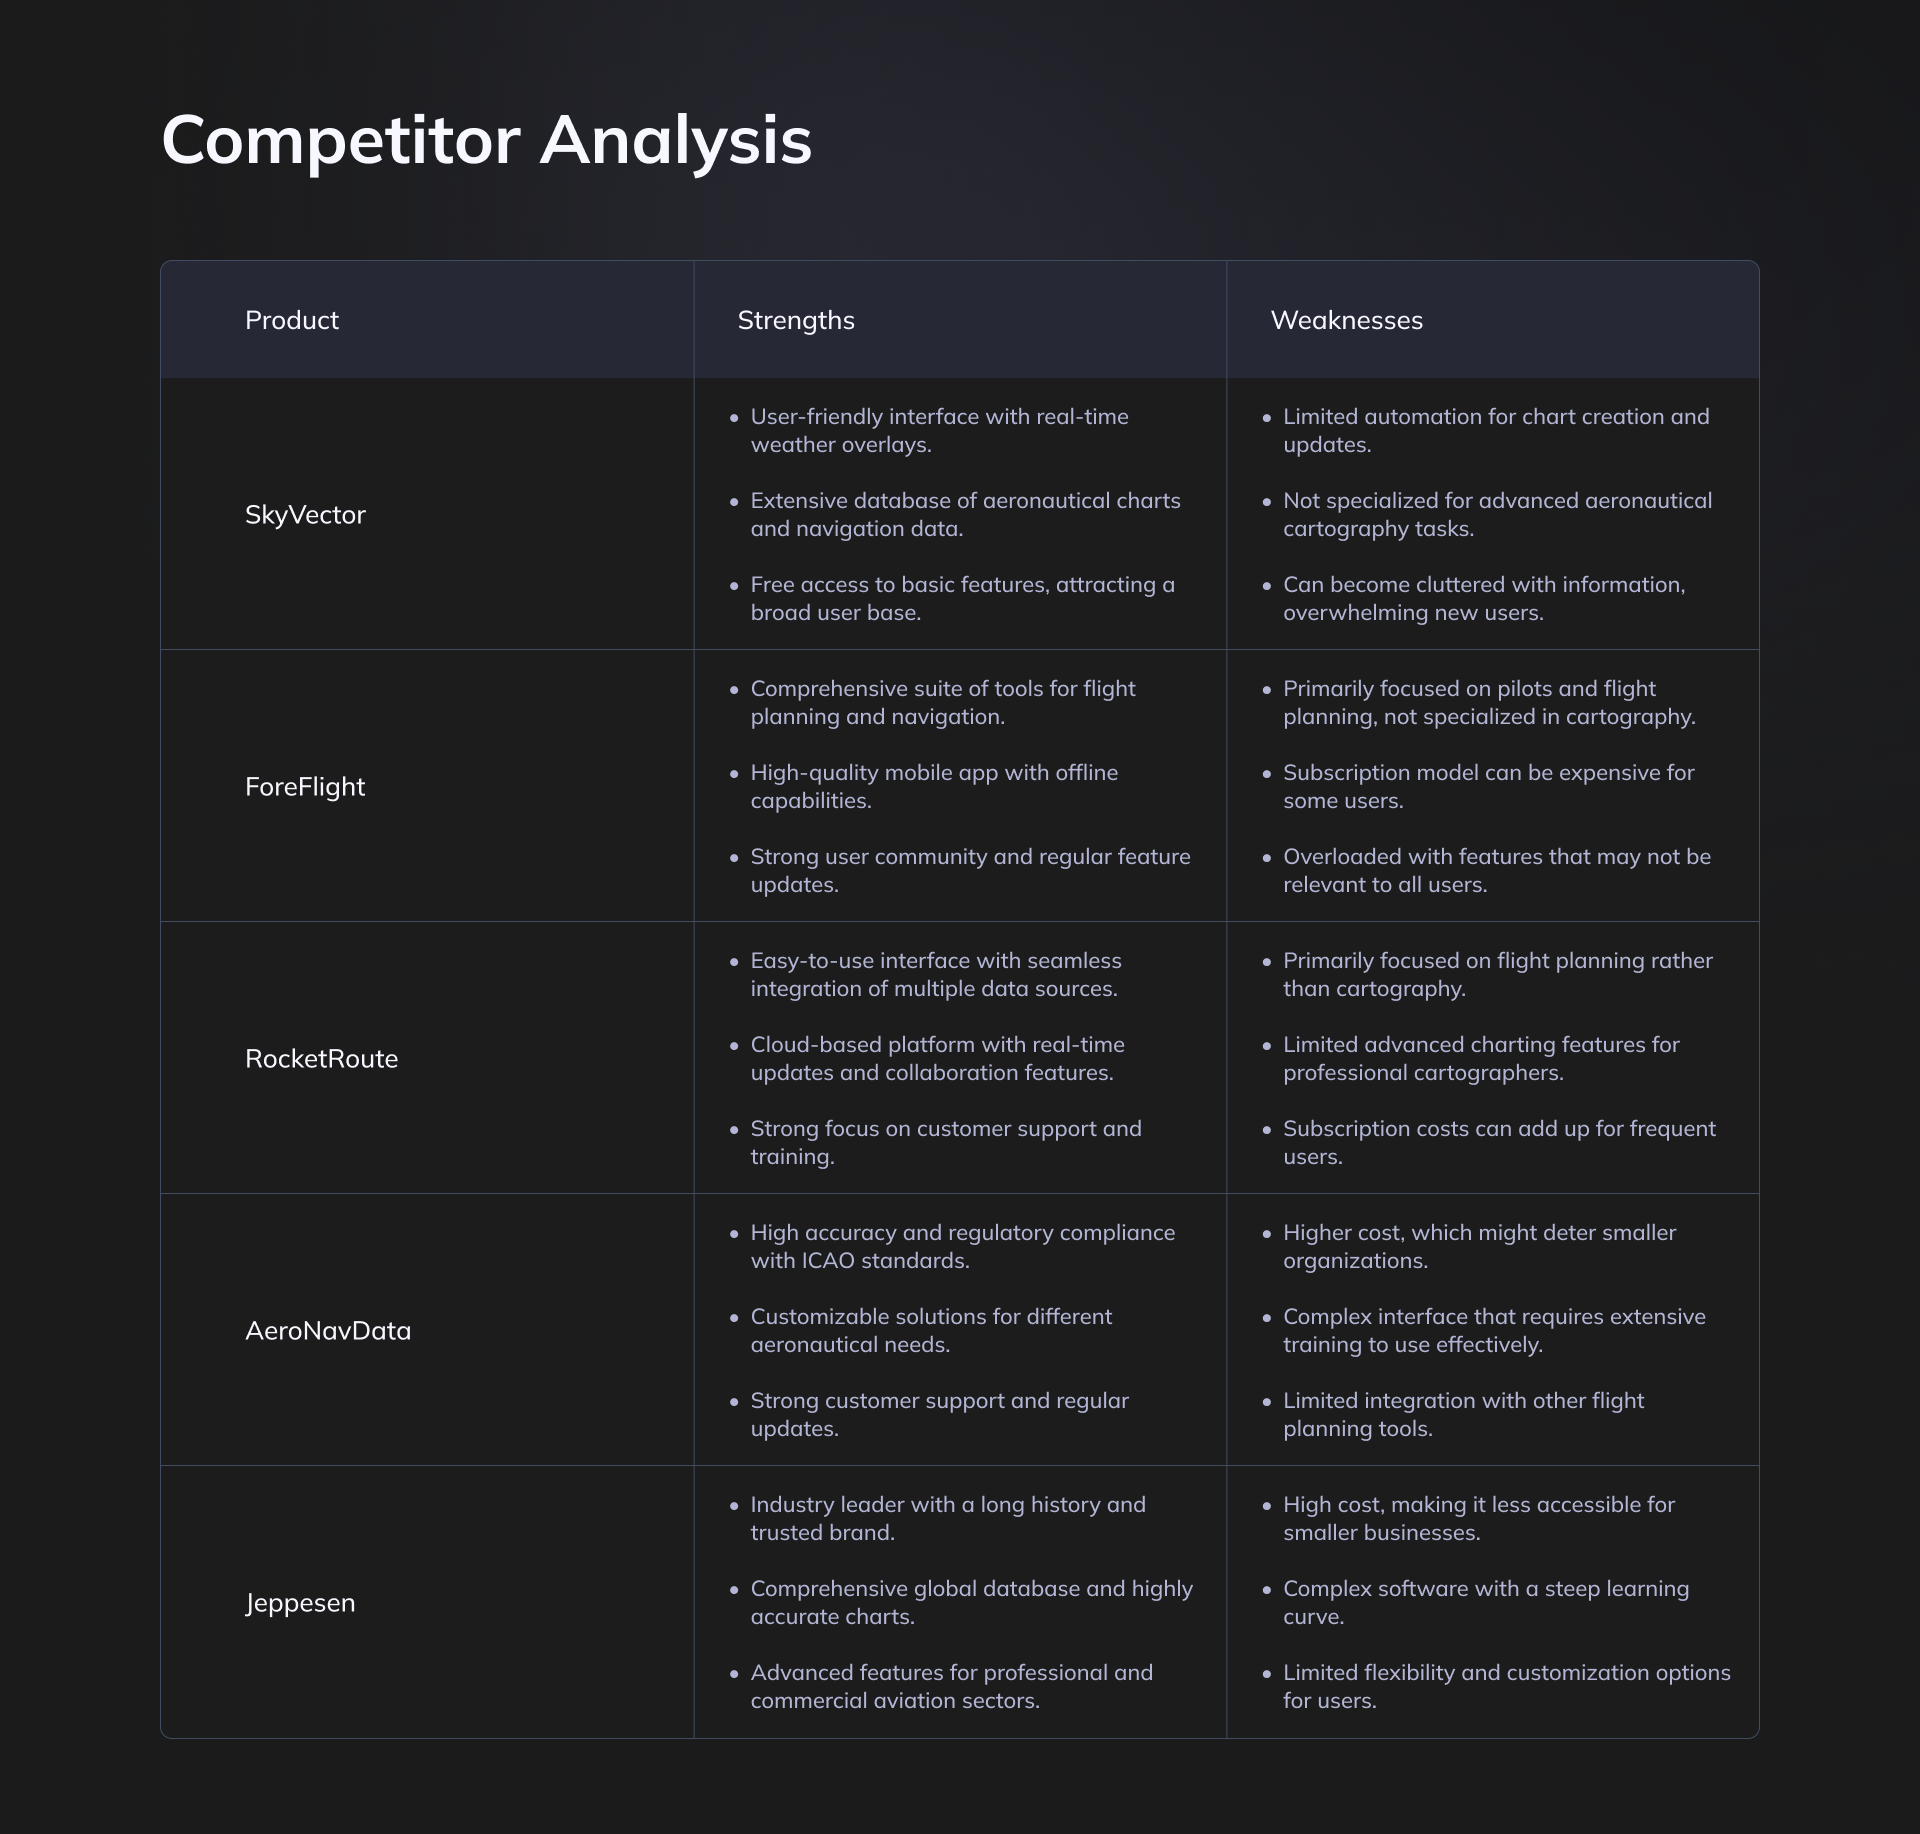
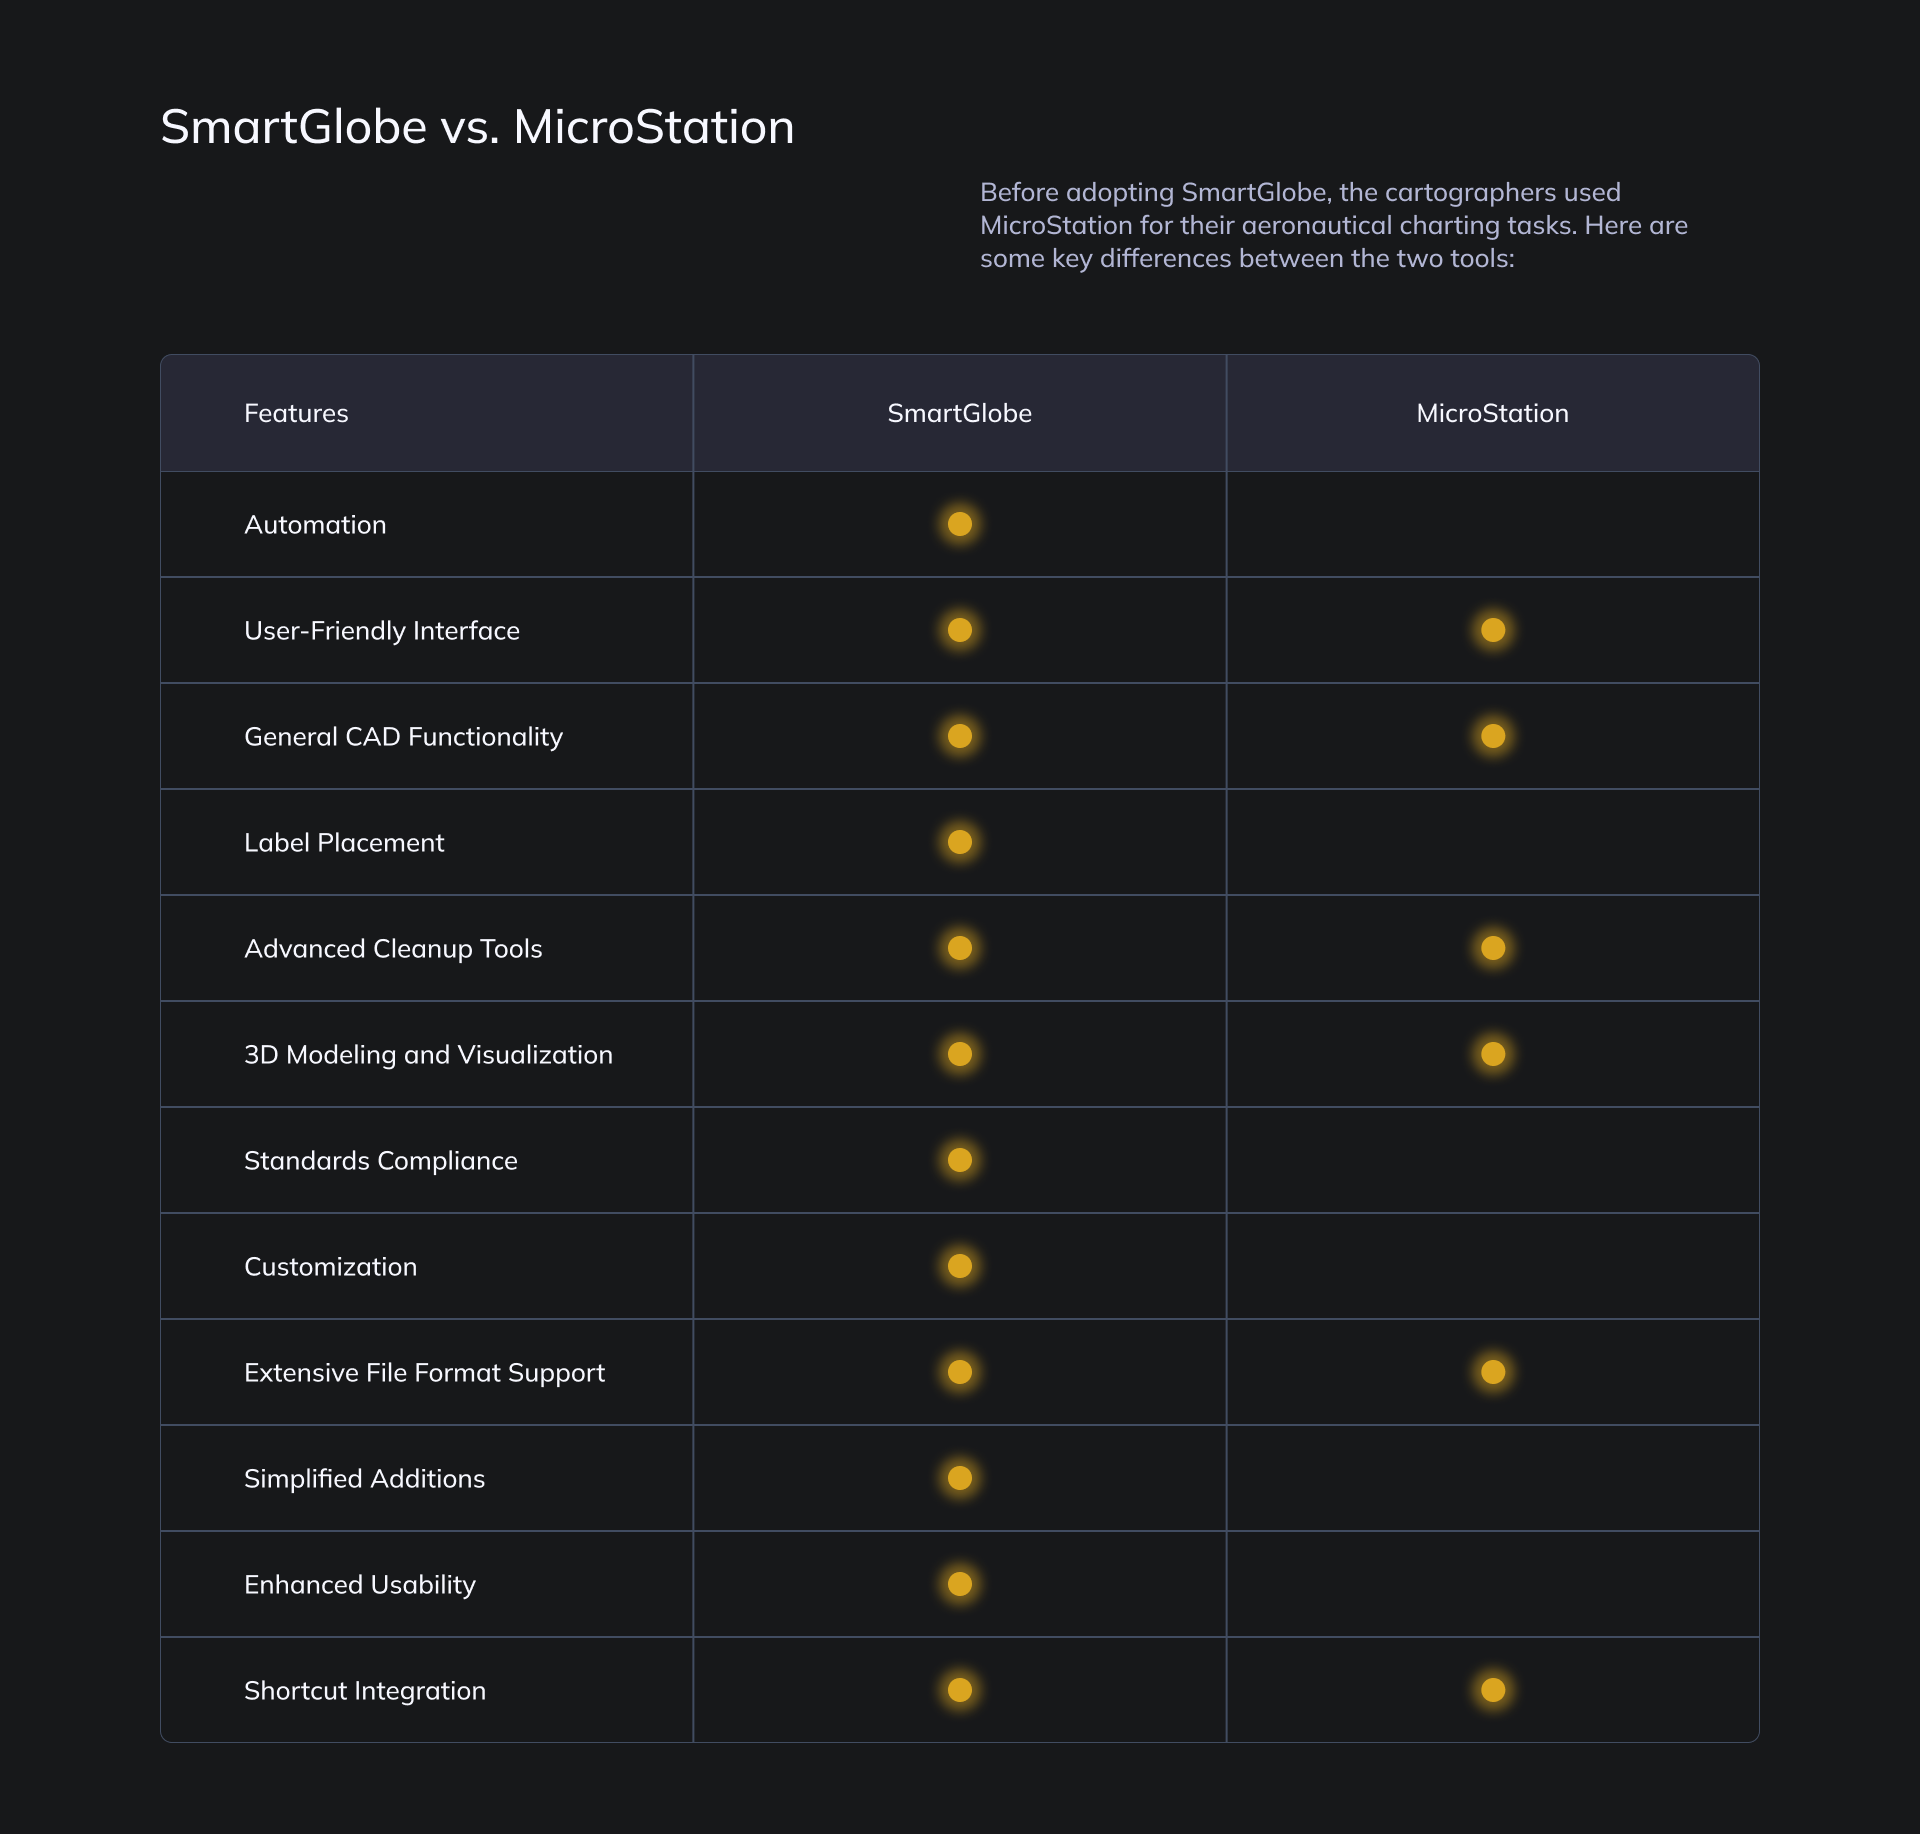
Artifi Labs partnered with Cadac Group to redesign SmartGlobe's entire charting workflow, from raw aeronautical data through to export-ready, ICAO-compliant charts. The process started with user research and workflow analysis alongside working cartographers, followed by a competitive review of tools like MicroStation, SkyVector, and Jeppesen to identify where existing solutions fell short.
From there, we moved through wireframes and interactive prototypes into a scalable Figma design system covering color, typography, and accessible light and dark mode variables. Every screen, from the plan view editor to the label and annotation tools, was designed to reduce manual effort and make compliance the default outcome, not a separate step at the end.
Project Highlights
0%
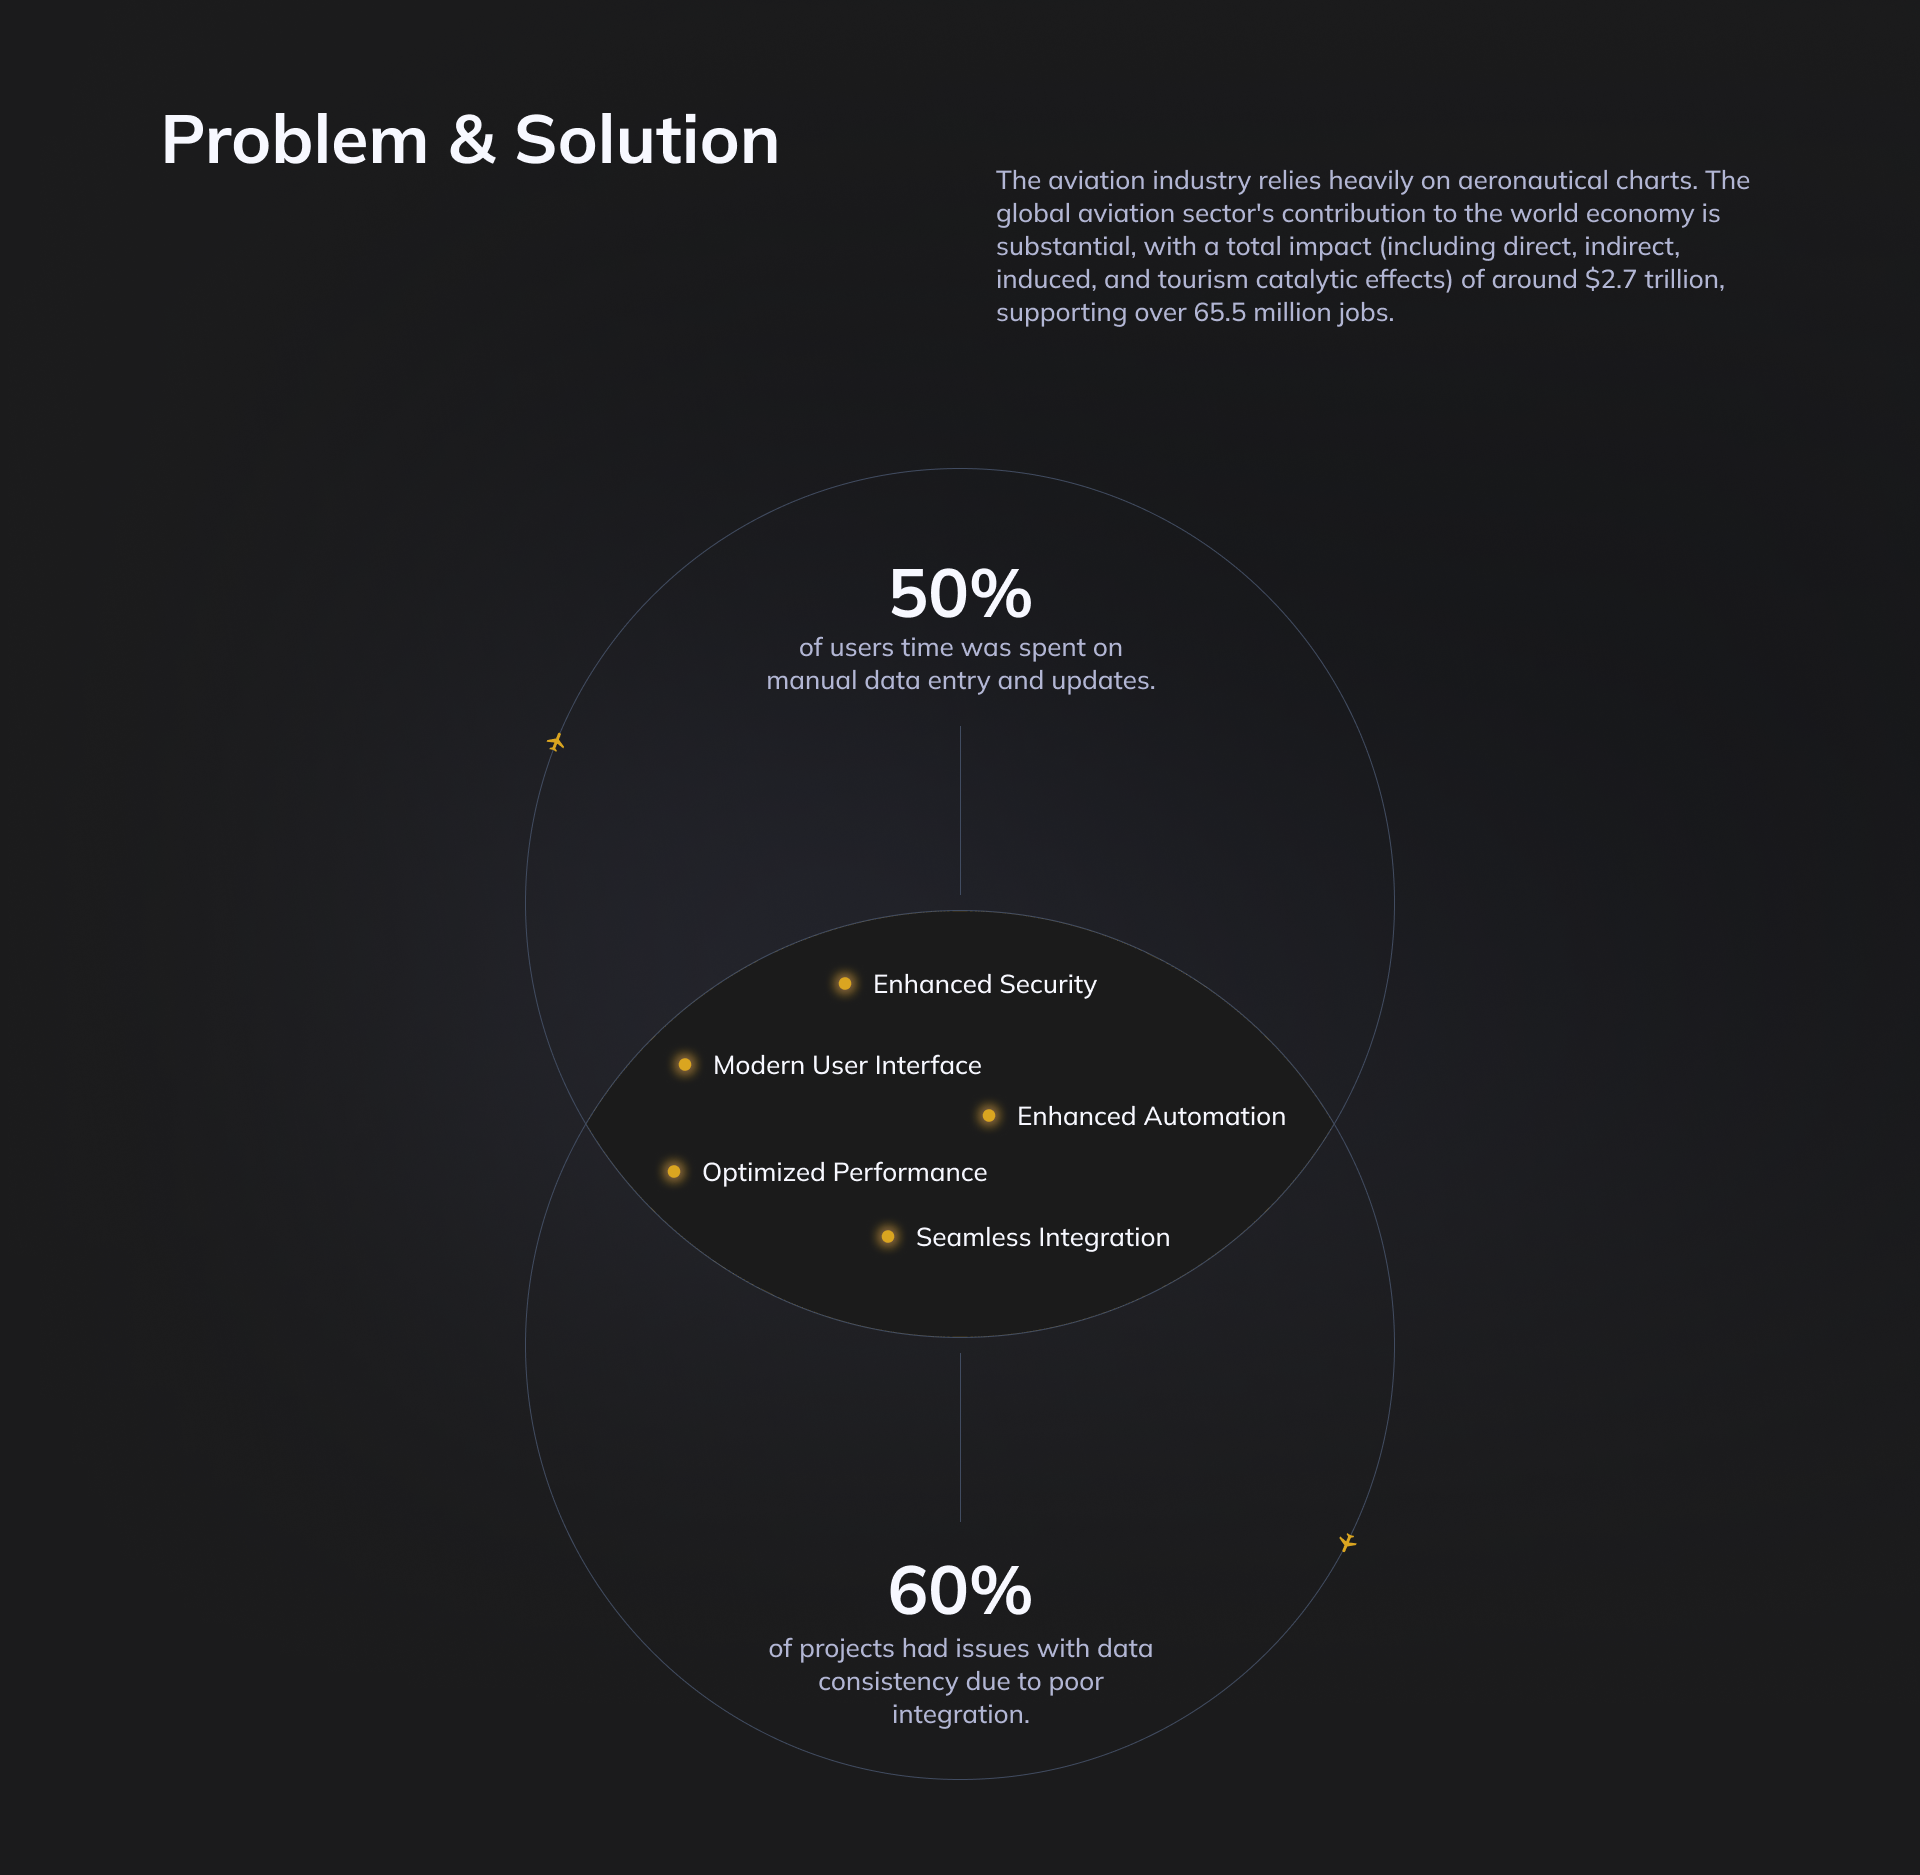
Reduction in time spent on repetitive manual data entry, by automating steps that previously required cartographers to input and cross-check data by hand.
0%
Fewer workflow bottlenecks, achieved by unifying previously disconnected data sources into a single integrated mapping process.
0%
Of the interface designed to support ICAO-compliant chart production, so accuracy and regulatory compliance are built into the workflow rather than checked afterward.
Images


Start a conversation
Ready to build something
remarkable?
Tell us what you're building. We'll tell you exactly how we'd approach it scope, architecture and honest timelines.